
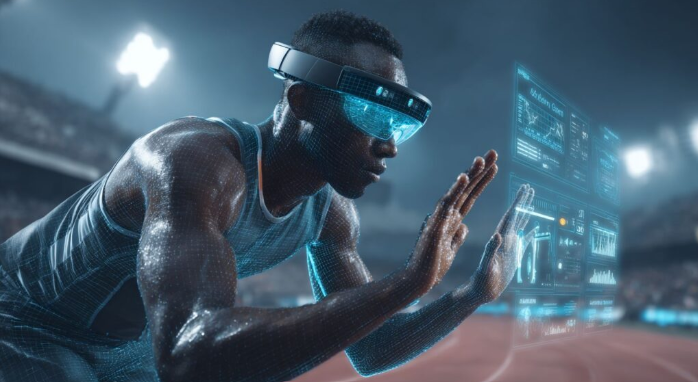
Just after the start of an international rugby match, a group of sensors worn by people stops sending clear signals. A stadium antenna stops working. The flow of player data slows significantly. Coaches and performance analysts use these feeds to make decisions right away. Any interruption can change the balance of competition. In the past, the club would have created a support ticket and hoped that someone would notice. Catapult’s AI support system recognises the user, the product, and that a live game is underway. If it identifies an issue, it contacts senior support immediately — before the coaching staff has even had time to notice something is wrong.
That story, from Catapult’s own account of how they rebuilt their support infrastructure in 2025, says more about where sports technology is in 2026 than most market reports do. The difference between a system that reacts after the event and one that acts in the moment is what the whole industry is actually competing on.
Why Post-Match Data Is Already Too Late
The sports analytics market was worth around $5.7 billion in 2025 and is growing by 15-24% annually. This range is based on estimates from different research firms, but the direction of growth is the same. By 2030, most experts expect it to be between $9 billion and $30 billion.
The reason for this growth is not more data. Teams already have more data than they can process. The reason for this is that there is less time to react when something happens on the pitch.
Catapult’s Vector 8 system, which uses AWS IoT infrastructure, collects 600 different measurements for each player during each game. That number is surprising, but it’s important to remember that most of those measurements are only useful if they are available quickly enough to make a difference. The system checks live data 10 times per second during a match — things like how fast the player is moving, how fast they are running, where they are on the field, and their heart rate — and sends it straight to iOS apps on the sidelines. Coaches can see when a player is tired and make decisions about who to replace based on actual data, not what they think they saw from the bench.
The data, which is cold and sampled at 100 Hz, is processed after the game for more in-depth machine learning analysis. There are two data speeds for two different decisions. This difference — using live data for in-game choices and high-resolution data for longer-term planning — is the structure around which serious platforms are built in 2026.
What Technology Convergence Actually Looks Like
The phrase “unified platform” is used a lot, but it usually means very little. In practice, most teams were dealing with this problem three years ago: the GPS data from Catapult was in one system, the video analysis from Hudl was in another, and the biometric monitoring from WHOOP was in another app. At the end of each session, someone had to manually export files across all of them.
That way of working is mostly gone at the top level. The better platforms now integrate data from wearables, video, and biometric sources into a single platform. The device shows the external mechanical load (e.g., how fast and far the user runs) and the internal metabolic load (e.g., the user’s heart rate and how hard they are trying) simultaneously, in real time.
Optical tracking is another layer of technology. Systems from Second Spectrum and Hawk-Eye track where the ball is in relation to the whole pitch, measuring over 10,000 points on the surface every second. Computer vision uses this information to automatically identify events, such as when the ball is passed to a player, or when a player takes a shot. What used to take an analyst three hours after the match now happens during it.
The gap between what the best clubs can do now and what mid-level organisations can achieve is larger than the market data suggests. The technology exists, but not everyone has the skills or the money to use it.
Predictive Models: From xG to What Happens Next
In 2016, Expected Goals was a big deal. By 2026, it’s essential. The question teams and platforms are trying to answer now is not “how did that chance come about?” but “what will happen in the next fifteen minutes given this pattern of play?”
Stats Perform’s OptaAI Studio, officially launched in 2025, uses historical Opta data as well as real-time match data to generate automated narrative insights and tactical predictions. In May 2025, the European League of Football signed a multi-year deal with Stats Perform. This deal will be given to all 16 teams at the same time. Kitman Labs joined forces with Unrivaled, the women’s 3-on-3 basketball league, in March 2025. Together, they created a platform that brings all the medical and performance data from the entire league into one place and updates it in real time.
The most important thing is to prevent injuries, and people pay close attention to it. There are computer programmes that can predict when an athlete is about to get injured. These programmes look at various factors, such as how much the athlete trains, how well they recover, the quality of their sleep, and their past injuries. It’s easy to see that it’s worth keeping a starting forward on the pitch for six weeks longer than they would have otherwise lasted. This is true for almost any other technology investment in sport.
It’s important to question how accurate these models are, as the vendors claim. Some clubs have been using them for three or four years, and the results have been mixed. The technology works better for some injuries than others, and for players who have been injured longer than for those who have been injured for shorter periods. This doesn’t mean it’s wrong — it’s a reason to understand what it actually does.
Data Infrastructure: The Part Nobody Talks About in Press Releases
In July 2025, Sportradar updated its NCAA Football API to include expected latency values — 2, 10, 25, or 50 seconds — for each game feed. This number tells downstream applications how far behind real-time the data is, so they can synchronise it properly with video overlays or live betting interfaces.
This small technical change reveals something bigger. The whole business of live sports – like the odds for in-play betting, the on-screen graphics, fantasy sports scoring, and how media is produced – relies on data pipelines. In some cases, a 10-second delay can make or break a product. Sportradar’s live data feeds are sent to sportsbooks, media companies, and team analytics platforms simultaneously. When something happens in a match – like a goal, a player being substituted, or a yellow card being given – the odds, a highlight clip, and a tactical database entry are all updated at the same time.
This is what API-first architecture actually means in practice. It’s not just a buzzword about flexibility, but a specific plumbing choice that determines whether a platform can serve multiple use cases from a single data source without someone manually copying information between systems.
Where Dexsport Fits Into This
The convergence happening in sports performance data — live feeds, automated processing, real-time settlement — mirrors what decentralised betting platforms are trying to do with wagering infrastructure.
On Dexsport, sports results come from verified external data sources, smart contracts hold the funds during a bet, and payouts execute automatically when the outcome is confirmed—no human approval in the chain. The same idea that makes a 2-second delay in a Sportradar feed not matter — getting rid of the human decision point — is also used to explain how money moves when a match ends.
We still don’t know whether betting infrastructure spread out can be as big and reliable as that in one place. The technical model is good. The operational track record at high volume is shorter. That’s something we should be honest about.